Project Front Page | Last updated: Wed May 20 2026
This page provides a central hub for project updates, events, and links to
the Planning Atlas
and related resources. It supports the hurricane evacuation study by keeping participants
and stakeholders informed about meetings, draft reports, and key materials. The site is a
working resource and will evolve throughout the project. For questions or requests, contact
Alexander Abuabara
at abuabara@tamu.edu.
Texas Gulf Coast Evacuation Zones and County Boundaries (Link to Download Evacuation Zones)
Comprehensive evacuation zone boundaries and related demographic and infrastructure statistics for key Gulf Coast regions of Texas to support emergency preparedness and planning.
County Evacuation Zones Mapbook
(PDF by Page Size)
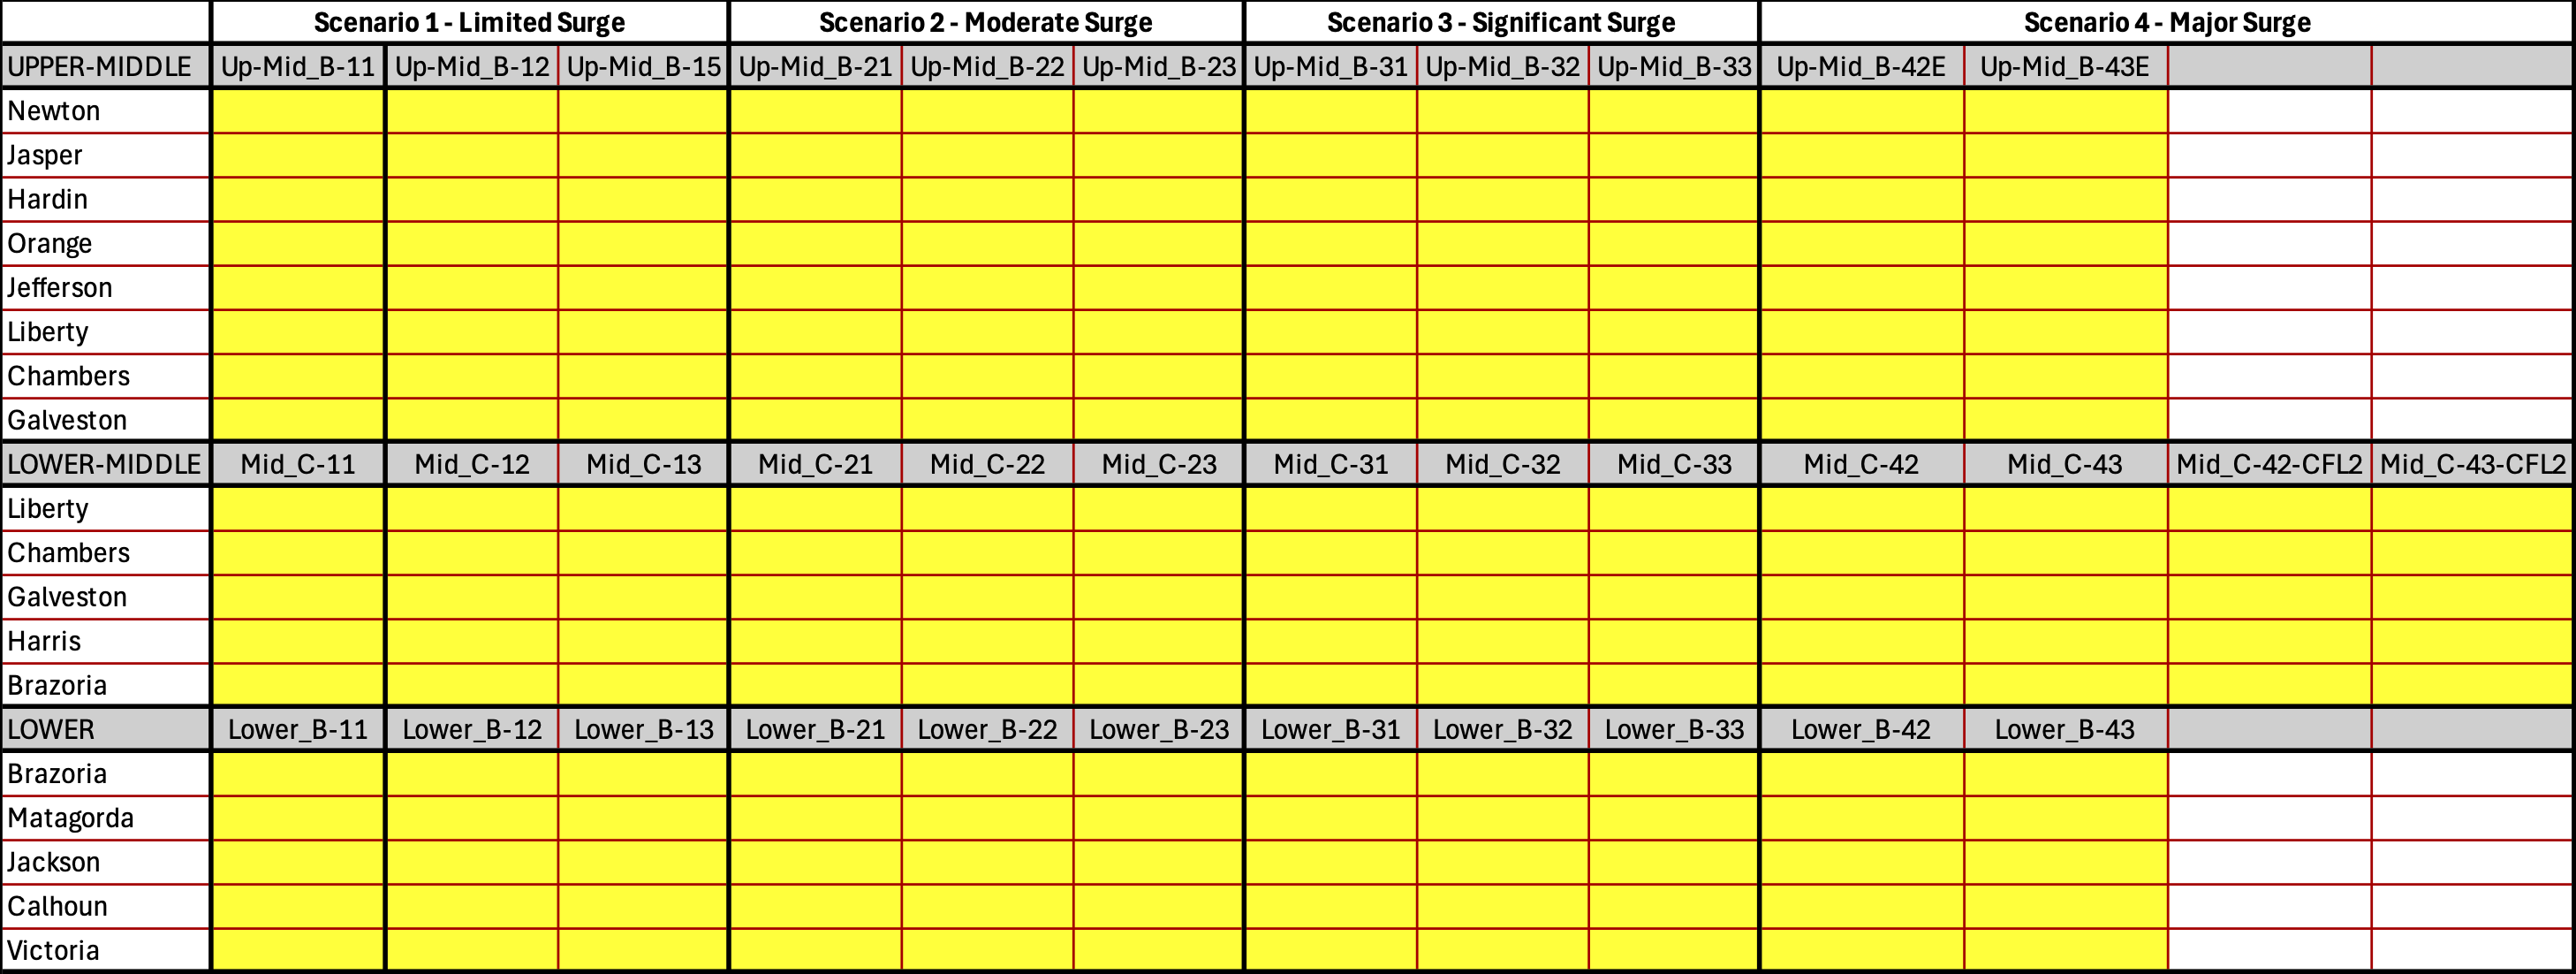
12-hr Scenario Clearance Curves
Using a custom-developed script, we processed the evacuation results from RtePM for
multiple runs, reading a GIS shapefile of block-level results,
aggregating vehicle counts by zone and time interval, and transforming those
counts into a "cumulative evacuated proportion" time series per zone and scenario.
The script parses zone labels into county and planning-zone categories,
standardizes the planning-zone names and ordering, and for each county generates
a graph consisting of (1) line curves of evacuated proportion over time for all
planning zones in that county and (2) a small summary table reporting the estimated
time (via linear interpolation) when each curve reaches 50% and 90% evacuation.
The table layout below shows which graphs are available for each county under
each scenario.
SETX_EvacZonePopVehHotel.xlsx
Table of population, household, vehicle, hotel occupancy, hotel vehicle, mobile home occupancy, mobile home vehicle estimates for SETX study area.
Population estimate is from LandScan 2021.
Household and mobile home population and vehicle estimates are filtered by LS 2021.
Hotel capacity is from the 2022 Texas Comptroller of Public Accounts Hotel Occupancy Tax tables.
parcels_frequency_with_imp_value.csv
The land parcel data were acquired from the
Texas Geographic Information Office (TxGIO) Strategic Mapping Program (StratMap).
These statewide parcel datasets are derived from the authoritative parcel information maintained at the county level by local appraisal districts and, where applicable, third-party vendors.
TxGIO aggregates and standardizes these contributions into a common GIS schema for broad distribution via the TxGIO DataHub.
This table shows the number of properties with any improvement value in each evacuation zone.
Properties are grouped by state property classification, as provided in the data.
Each row represents an evacuation zone, and the columns display the count of properties of each type within that zone and county.
parcels_sum_imp_value_in_millions.csv
This table shows the total improvement values (2024) for properties in each evacuation zone.
Properties are grouped by state property classification, as provided in the data.
Each row represents an evacuation zone, and the columns display the sum of improvement values as provided in the data for all properties of each type within that zone and county.
In previous Hurricane Evacuation Studies undertaken by the National Hurricane Program,
the Texas coast was divided into four evacuation study areas: the Rio Grande Valley
(Hidalgo, Cameron, & Willacy), Coastal Bend (Kenedy, Kleberg, Nueces, San Patricio,
Aransas, Refugio, Calhoun, & Victoria), Houston/Galveston (Jackson, Matagorda, Brazoria,
Harris, & Galveston) and Sabine Lake (Chambers, Liberty, Jefferson, Hardin, Orange,
Jasper, & Newton).
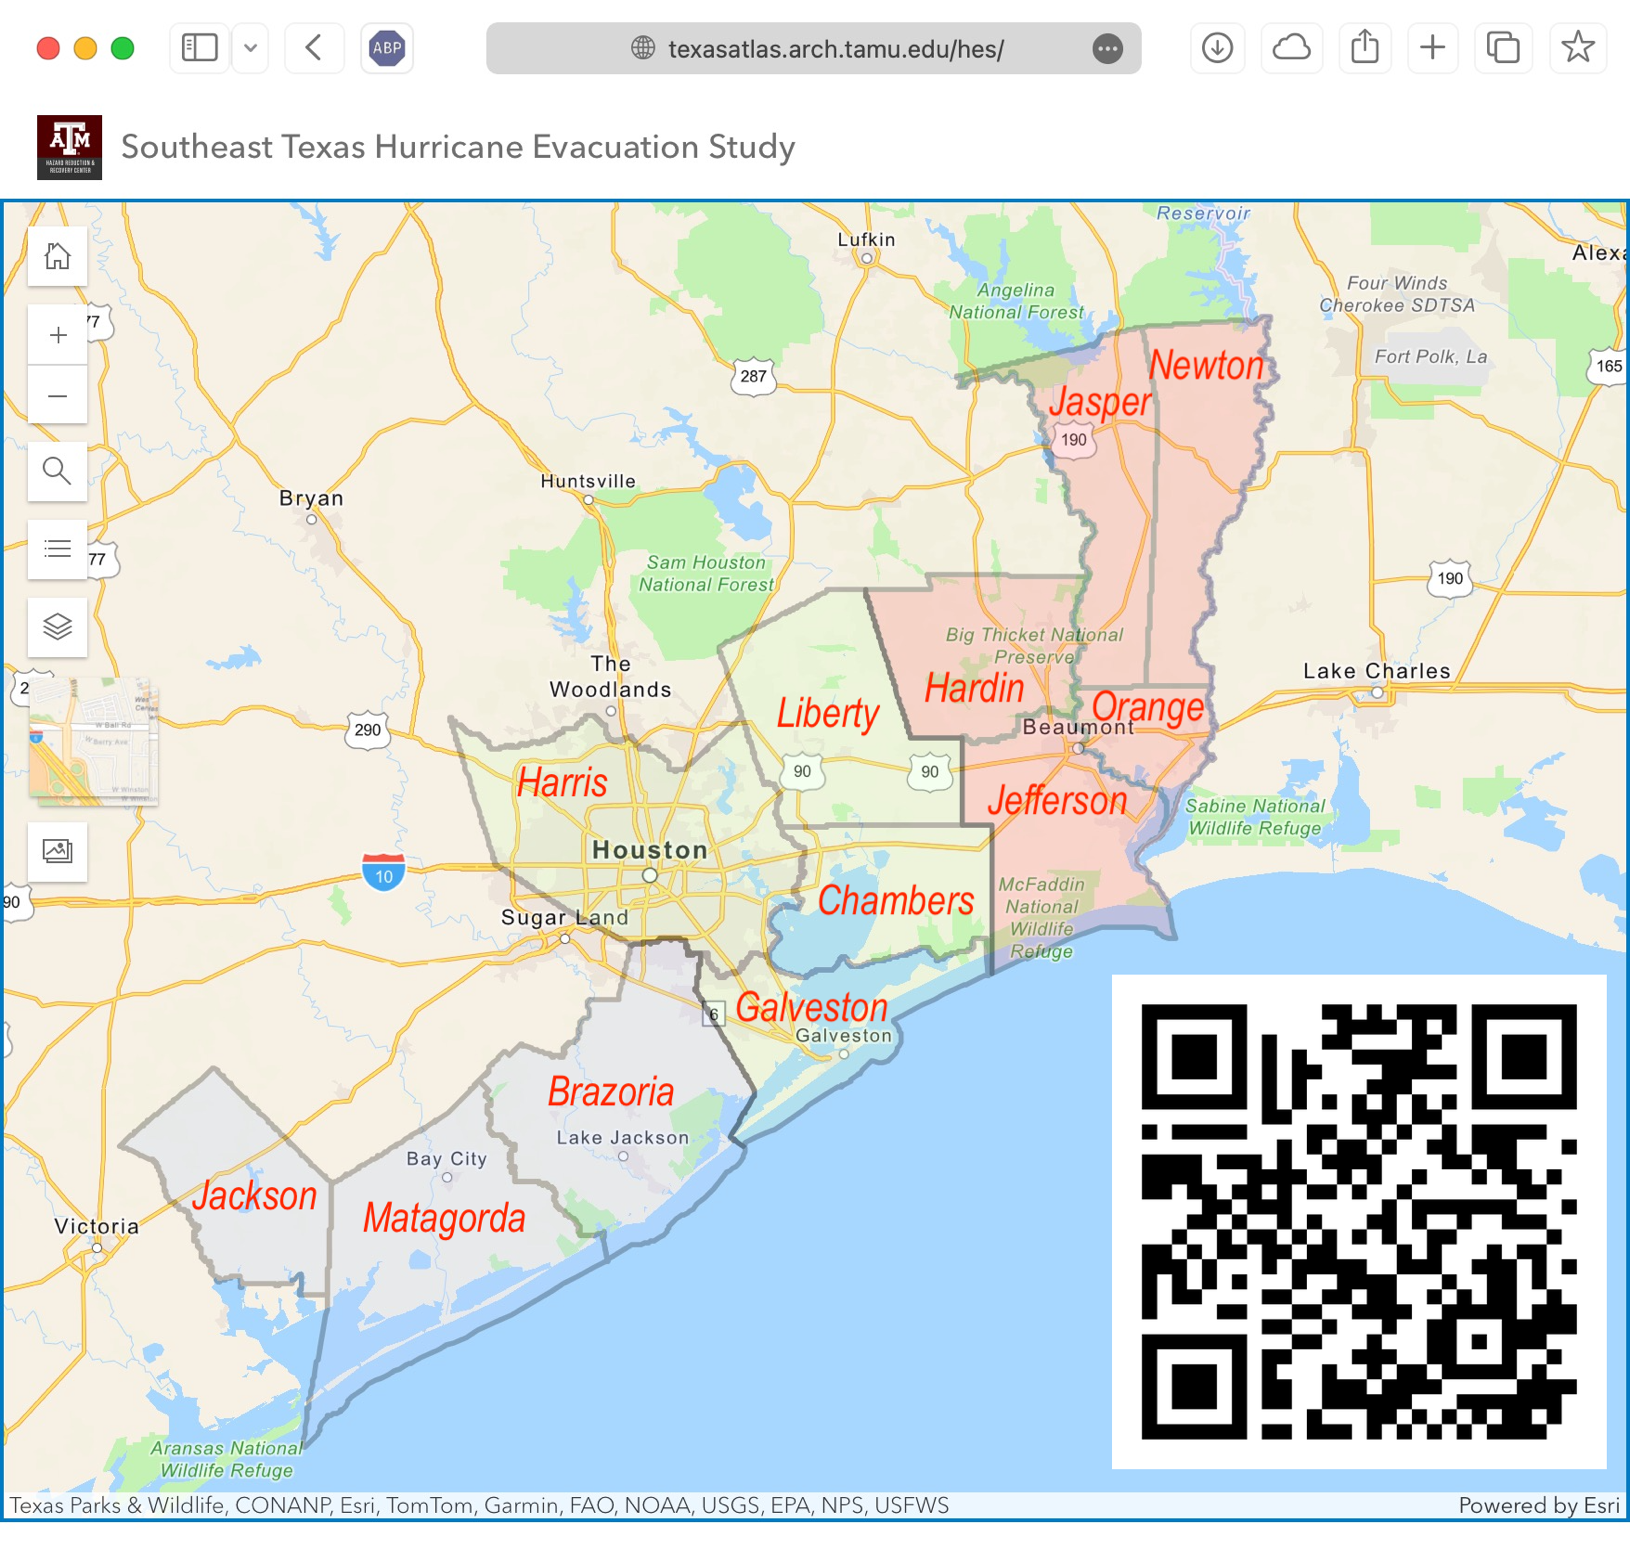
This time, the 12 counties comprising the Houston/Galveston and Sabine Lake study areas have been
combined into one single study area, the Southeast Texas Hurricane Study Area.
To facilitate the Hurricane Evacuation Study process, particularly when holding workshops
to work more closely with county/municipality and other stakeholders, the 12 counties have been
divided into three planning zones: Upper, Middle, and Lower. The counties in each planning zone
are as follows: